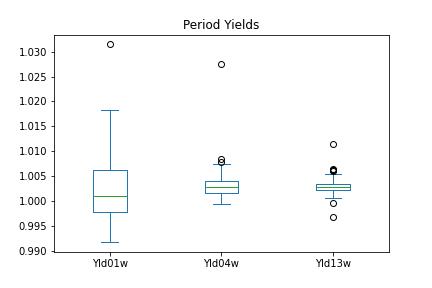
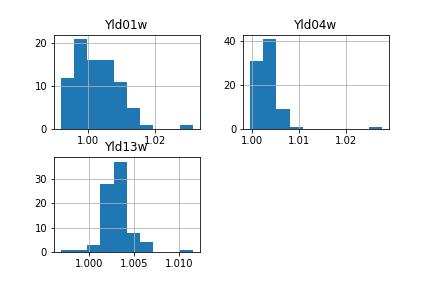
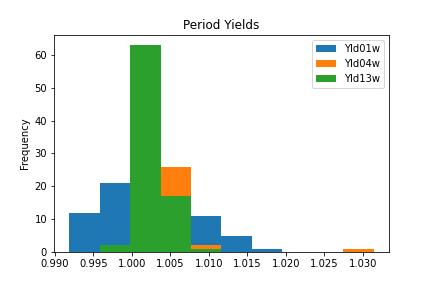
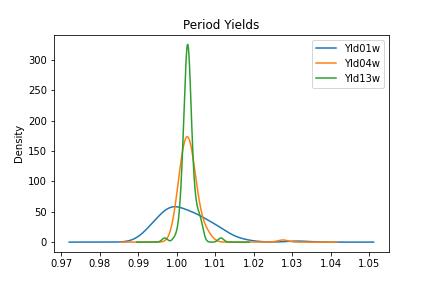
Comparative Period Daily Mean Yield Factors of 83 Selected Stocks using Boxplots, Histograms, and Density graphs. The periods are one, four, and 13 weeks. This illustrates how the same data can be visualized in different ways.
Comparative Period Daily Mean Yield Factors of 83 Selected Stocks using Boxplots, Histograms, and Density graphs. The periods are one, four, and 13 weeks. This illustrates how the same data can be visualized in different ways.